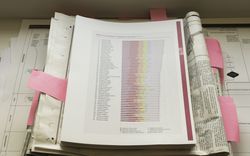
Consolidated Happiness
A survey of surveys
In the last decade, a proliferation of happiness and well-being surveys has provided the backbone to a growing field of happiness research. Deployed at various scales (office, city, nation, world), these surveys put forth questions about feelings and moods, often in reference to personal matters such as finances, community, and worldview. It is through a mass accumulation of imperfect data, especially over time, that trends emerge. The information that can be deduced from survey responses does not always explicitly answer the questions posed: for example, one person’s answer to a question about sense of community may indicate their perception of their own relationships, and a larger pool of answers from one location may reveal an informal social support network. Thus the work of the survey is complicated both in its making and in its production of data—the choice of which questions to ask, the use of specific syntax and terminology, and the assumption of cultural biases must all be considered.
To question the survey, to question the question, and to question the act of answering a question, we constructed a hybrid survey. The questions here were gathered and reproduced from a selection of regional and national surveys utilized in recent efforts to quantify happiness as a metric of societal progress. The survey was sent out to twenty-two individuals (CCA and external collaborators) who are contributing to the project, Our Happy Life; sixteen responded, anonymously.


